I connect the systems you already run, model the data so every number means one thing, and turn it into dashboards — and AI you can actually ask questions of. One person, start to finish.
The animation shows business systems such as QuickBooks, a CRM, point of sale and payroll feeding into a lakehouse, where data is modeled into a sales fact table with customer, product, date, sales rep, location and channel dimensions, then published through a semantic layer to Power BI reporting and an AI assistant connected by an MCP server.
Most projects stall at a handoff — the person who moves the data isn't the person who models it, and neither of them builds the report. I do all three, so nothing gets lost in translation.
Connect the systems you already run — accounting, CRM, point of sale, payroll, spreadsheets — and land the data somewhere central on a schedule. No more exporting by hand.
Shape raw records into a star schema with a semantic layer on top: one definition per metric, relationships that hold up, history you can query. This is the part that makes everything downstream trustworthy.
Where the value actually lands. Dashboards for the numbers you watch every week, and AI you can ask the questions a dashboard never anticipated — both reading from the same governed model.
Ingestion and modeling are the foundation — worth doing well, but nobody buys a foundation. These are the things you actually use. Start anywhere on the list; each one builds on the last.
Power BI reports built on the modeled layer, so every number traces back to one definition. They refresh on a schedule and are built to hand off — nobody rebuilds them by hand each month.
An MCP server connects an AI assistant straight to your data model, so you can ask questions in plain language and get answers grounded in your actual records — not a guess from a chatbot.
A finished layer built for AI to read: certified metrics, business definitions and guardrails above the model. The assistant answers from the same logic as your reports, so the number in chat matches the dashboard.
Interactive Power BI dashboards that give you instant visibility into the metrics that matter most.
Eliminate repetitive reporting by automating data collection, transformation, and visualization.
Turn your business data into decisions with meaningful KPIs and executive reporting.
Organize and optimize your data so reporting is accurate, reliable, and scalable.
Get data out of the systems you already use and into one place, on a schedule, without manual exports.
Connect an AI assistant to your data model so your team can ask questions and get answers they can trust.
I work directly with business owners and teams to understand how they operate before building solutions that actually solve problems.
I've worked with organizations across multiple industries to improve reporting, streamline workflows, and help teams make better decisions with their data.
Learn your business and understand your reporting challenges.
Create dashboards and reporting solutions tailored to your goals.
Launch a solution that's easy to use and built to grow with your business.
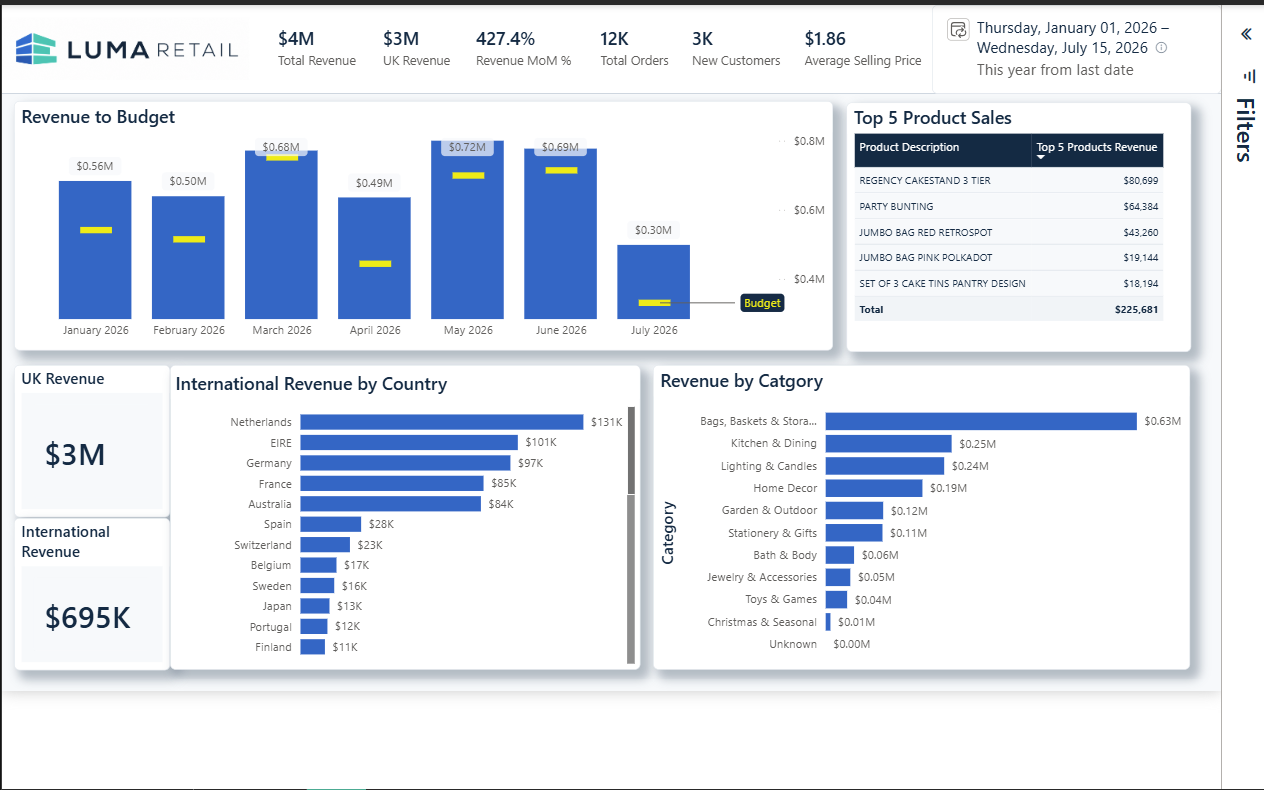
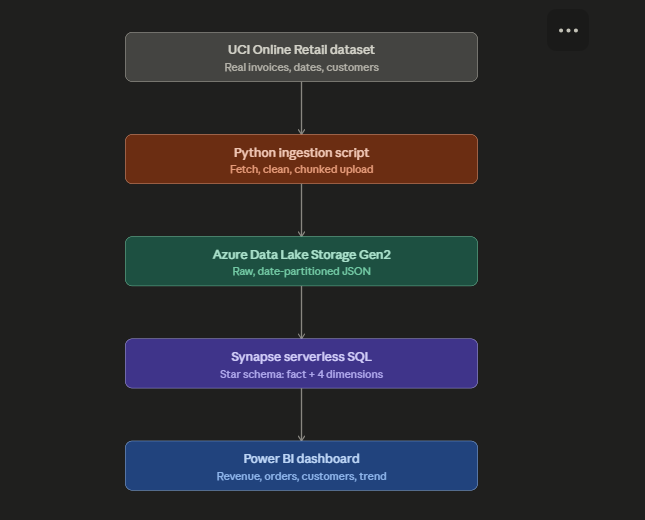
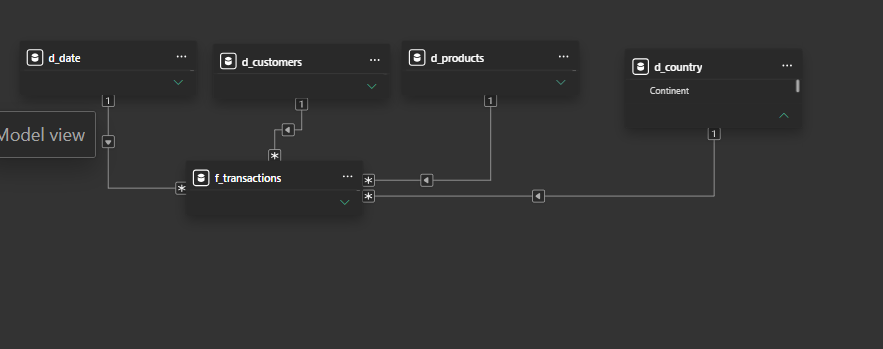
A complete analytics solution built from raw transaction data. A Python script ingests and cleans real retail invoice data, lands it in Azure Data Lake Storage, and Synapse serverless SQL shapes it into a star schema — powering a Power BI dashboard that tracks revenue against budget, top products, international sales, and category performance.